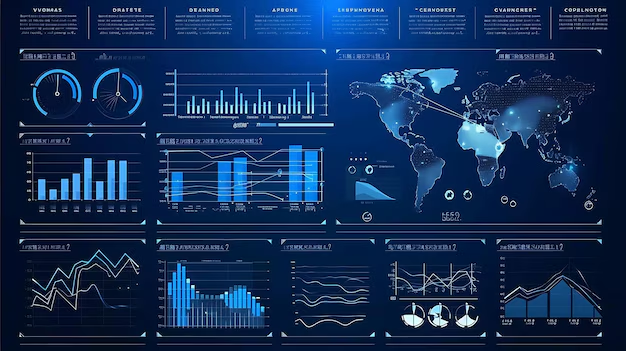
Financial organizations operate in data-intensive environments where decisions must be made quickly, accurately, and with confidence. Raw data alone is not enough leaders need clear visibility into performance, risk, and opportunities. Business Intelligence & Data Visualization bridges the gap between data and decision-making.
At DataConsulting.com, we help financial institutions and fintech companies transform complex datasets into intuitive dashboards, reports, and visual insights. Our BI and visualization solutions empower executives, analysts, and operational teams to understand trends, monitor KPIs, and act decisively without relying on technical intermediaries.
Creating a Single Source of Truth
Disparate reports and inconsistent metrics often lead to confusion and delayed decisions. We design business intelligence frameworks that consolidate data into a single, trusted view of your organization’s performance.
By integrating data from multiple financial systems and aligning metrics across teams, we ensure consistency, transparency, and confidence in reporting. This unified approach enables leadership to make informed decisions based on accurate, real-time insights.
Executive Dashboards for Strategic Visibility
Executives need instant visibility into key performance indicators without navigating complex reports. We design executive-level dashboards that highlight what matters most revenue, risk exposure, operational efficiency, and growth trends.
Our dashboards present critical insights in a clear, visual format, enabling leadership teams to quickly assess performance, identify issues, and take action. These tools support faster, more confident strategic decision-making across the organization.
Interactive Reporting for Deeper Analysis
Static reports limit exploration and insight discovery. We build interactive BI solutions that allow users to drill down into data, explore trends, and analyze performance from multiple perspectives.
From risk and compliance teams to finance and operations, our interactive reports empower users to answer questions in real time. This flexibility enhances analytical capability while reducing dependence on manual reporting processes.
Visualizing Risk, Compliance, and Performance
In regulated financial environments, visibility into risk and compliance is essential. We design visualizations that clearly communicate risk exposure, compliance metrics, and control effectiveness.
Our BI solutions support regulatory reporting, internal audits, and risk monitoring by transforming complex metrics into intuitive visuals. This enables teams to identify anomalies, track thresholds, and maintain oversight with confidence.
Scalable, Secure, and Self-Service BI Platforms
As data volumes grow, BI platforms must scale without compromising performance or security. We design and implement scalable, self-service BI environments that empower users while maintaining governance and control.
Our solutions integrate seamlessly with modern data platforms and support role-based access, security controls, and auditability. This ensures insights are accessible, trusted, and aligned with compliance requirements.
Our Approach to Business Intelligence & Visualization
We deliver BI solutions through a structured, results-focused approach:
Requirements Discovery: Identify KPIs, users, and reporting needs
Data Alignment: Ensure data accuracy and consistency
Platform Enablement: Deploy scalable BI tools and environments
Adoption & Optimization: Train users and continuously improve insights
Business Intelligence & Visualization transforms data into clarity. By providing real-time visibility and intuitive insights, financial organizations can move faster, manage risk effectively, and make smarter strategic decisions.
At DataConsulting.com, we help you turn financial data into actionable intelligence through powerful BI and visualization solutions. Contact us today to discover how we can elevate your decision-making with clear, confident insights.

-1-1024x668.jpg)