In today’s fast-moving financial landscape, timely decisions are critical. Traditional reporting processes often rely on technical teams, resulting in delays and limited flexibility for business users.
At Datageny.com, our Self-Service BI & Executive Dashboard services empower users across the organization to access, explore, and analyze data independently. We design intuitive BI environments that enable decision-makers to generate insights without relying on manual reports or IT support.
This self-service capability accelerates decision-making and improves operational agility.
Executive Dashboards for Financial Performance Visibility
Leadership teams require clear, concise, and accurate views of performance across the organization. Without centralized dashboards, executives struggle to monitor KPIs, identify risks, and track strategic initiatives.
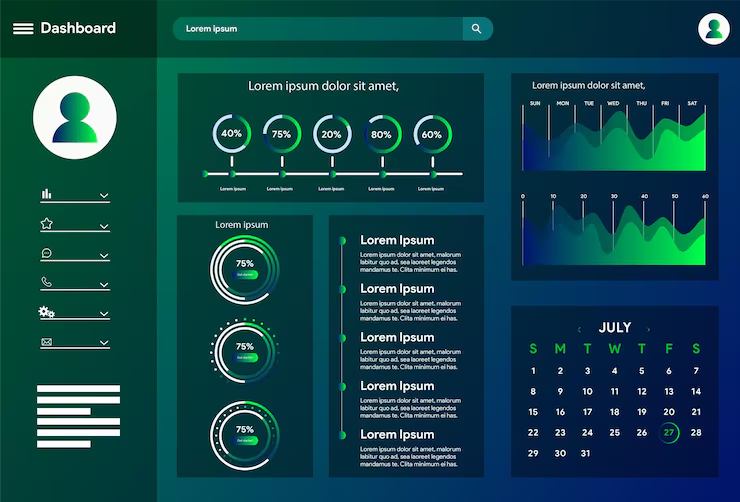
We design executive dashboards that provide a real-time view of financial performance, risk exposure, customer metrics, and operational efficiency. These dashboards translate complex data into actionable insights aligned with strategic goals.
Executives gain clarity, confidence, and control over business outcomes.
Real-Time Reporting and Interactive Visualization
Static reports quickly become outdated and limit analytical depth. Interactive and real-time visualization unlocks deeper understanding and faster responses to change.
Our BI solutions enable real-time reporting and interactive drill-downs, allowing users to explore trends, exceptions, and performance drivers. We leverage modern visualization platforms to deliver responsive, user-friendly experiences.
This interactivity supports proactive decision-making rather than reactive reporting.
Standardized Metrics and Single Source of Truth
Inconsistent metrics across teams create confusion and erode trust in data. Financial organizations require standardized definitions and a single source of truth for reporting.
We help establish governed BI layers that standardize KPIs, metrics, and calculations across dashboards and reports. This ensures consistency, accuracy, and alignment with regulatory and internal reporting requirements.
A unified data foundation strengthens confidence in analytics outcomes.
Driving Adoption Across Business Teams
Even the most advanced BI tools fail without adoption. User experience, training, and alignment with business workflows are critical for success.
We focus on user-centric dashboard design, role-based access, and enablement strategies that encourage adoption across finance, risk, operations, and leadership teams. Our approach ensures BI becomes embedded in daily decision-making.
High adoption translates directly into higher ROI from analytics investments.
We deliver scalable and impactful BI solutions through a structured methodology.
Adoption & Continuous Improvement
Support ongoing usage, feedback, and enhancement.
Transforming Data into Actionable Intelligence
Self-service BI and executive dashboards are essential for modern financial organizations seeking agility, transparency, and informed decision-making. When designed correctly, BI becomes a strategic asset rather than a reporting tool.
At Datageny.com, our Self-Service BI & Executive Dashboard services help financial institutions unlock insights, improve performance visibility, and empower leaders at every level. Contact us today to elevate your business intelligence capabilities.